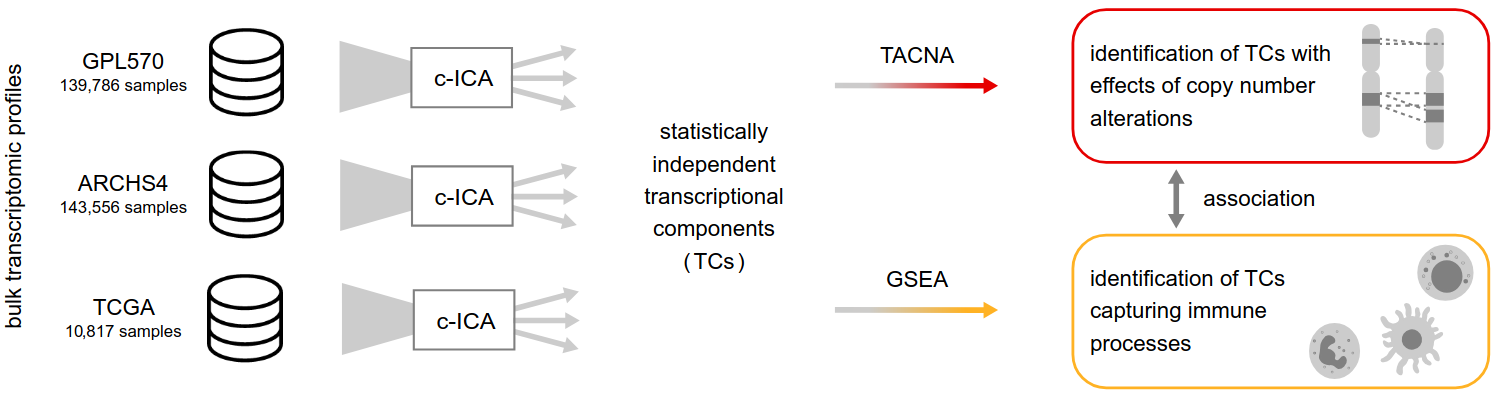
Association of copy number alterations with the immune transcriptomic landscape in cancer
Loipfinger S, Bhattacharya A, Urzúa-Traslaviña CG, van Vugt MATM, de Bruyn M, Fehrmann RSN. Association of copy number alterations with the immune transcriptomic landscape in cancer. Manuscript in preparation.
Raw data is available at: https://zenodo.org/records/13983463
Gene perspective
Explore which TC capture a transcriptional pattern with your gene of interest
gene format: HGNC symbol // GPL570 probeset ID // ARCHS4 gene symbol // TCGA NCBI ID
Gene set perspective
Explore which TC capture a transcriptional pattern enriched for your gene set of interest
TC perspective
Explore the biology of the transcriptional pattern captured by a TC
CNA- or immune-TC classification and concordance across datasets
Gene weights of the TC
Top 50 genes with absolute highest gene weights above >3:
Gene set enrichment analysis results
CNA burden association
Association of CNA burden with immune-TCs:
- Red: High CNA burden is associated with higher immune-TC activity
- Blue: High CNA burden is associated with lower immune-TC activity
Each cell in the plot shows two values: the upper-left triangle represents GPL570 cancer samples, and the lower-right triangle represents TCGA cancer samples.
Captured CNA region of CNA-TC
TC activity in different cell types from the single-cell tumor immune atlas for precision oncology
TC activity in spatial transcriptomic datasets from 21 tumor samples (from 10xGenomics)
Spatial images per sample: cancer id | raw image | inferred CNA burden | TC activity
CNA burden: low (white) →
high (red)
TC activity:
low (blue) →
high (orange)
Cancer type abbreviations:
BC: breast cancer; CC: cervical cancer; CRC:
colorectal cancer; GB: glioblastoma multiforme; IDC: infiltrating ductal carcinoma of the
breast; LC: lung cancer; M: melanoma; OC: ovarian cancer; PC: prostate cancer
CNA - immune association
Explore how CNAs associate with immune-related transcriptional patterns (captured by immune-TCs)
- Red: High CNA burden is associated with higher immune-TC activity
- Blue: High CNA burden is associated with lower immune-TC activity
Each cell in the plot shows two values: the upper-left triangle represents GPL570 cancer samples, and the lower-right triangle represents TCGA cancer samples.
gene format: HGNC symbol // GPL570 probeset ID // ARCHS4 gene symbol // TCGA NCBI ID
Association of gene CNA with immune-TCs:
- Red: High CNA values of the gene (TACNA profile) are associated with higher immune-TC activity
- Blue: High CNA values of the gene (TACNA profile) are associated with lower immune-TC activity
Each cell in the plot shows two values: the upper-left triangle represents GPL570 cancer samples, and the lower-right triangle represents TCGA cancer samples.
(Click on a table row to plot other CNA-TCs)
- Red: High CNA-TC activity is associated with higher immune-TC activity
- Blue: High CNA-TC activity is associated with lower immune-TC activity
Each cell in the plot shows two values: the upper-left triangle represents GPL570 cancer samples, and the lower-right triangle represents TCGA cancer samples.
Association of CNA-TC with immune-TCs:
- Red: High CNA-TC activity is associated with higher immune-TC activity
- Blue: High CNA-TC activity is associated with lower immune-TC activity
Each cell in the plot shows two values: the upper-left triangle represents GPL570 cancer samples, and the lower-right triangle represents TCGA cancer samples.
Association of immune-TC with CNA-TCs:
- Red: High immune-TC activity is associated with higher CNA-TC activity
- Blue: High immune-TC activity is associated with lower CNA-TC activity
Each cell in the plot shows two values: the upper-left triangle represents GPL570 cancer samples, and the lower-right triangle represents TCGA cancer samples.
Genewise TACNA association:
- Red: High CNA values of the gene are significantly correlated with higher immune-TC activity
- Grey: No significant correlation (p-value>0.05) between CNA values and immune-TC
- Blue: High CNA values of the gene are significantly correlated with lower immune-TC activity
CNA - immune association
Explore which genes occur most frequently with high weights across all immune-TCs